SMU SeatFinder: Finding you Seats, Saving us Time
Read on to see how our solution aims to provide a more pleasant and safe experience for the user by incorporating an IoT solution, with the growing need due to safe entry measures to limit the number of visitors to the library.
THE NEW NORMAL?

As the world continues its slow recovery from the COVID-19 pandemic, more public spaces are being reconfigured and reorganized to cope with the return to a sense of normalcy — whilst ensuring that measures are in place to lower any form of potential exposure.
The situation is similar in Singapore, with crowds returning, returning to public spaces such as libraries, malls, offices, and other co-working spaces.
“Last week there were queues but they were not as long. It definitely seems like more people have returned to work,” said Mdm Chua, who sells nyonya kueh and is in her 60s.
However, as safe-distancing measures are still in place, and snaking queues have reformed at these locations as managers of these public and private spaces try to adjust to ‘the new normal’. Experts and officials have warned that the measures in this ‘new normal’ would likely last for the next couple of years and managers of public and private spaces such as libraries have started looking at ways it can respond.
“If countries are able to find that sweet spot between some restrictions and a manageable degree of community transmission that is never allowed to get out of hand, lockdowns can be avoided completely.” Prof Teo Yik Ying, dean of NUS Saw Swee Hock School of Public Health.
Finding the right response has thus been critical a mission statement for some libraries because of the communities it can serve in the immediate to long term. These measures include prioritizing resources, moving non-essential programmes online and reducing exposure potential with adequate disinfection routines and distancing.
PORBLEM and MOTIVATION
We are similarly motivated by such goals (albeit with more self-interest) and have wondered how school libraries can improve management of its spaces, in order to accommodate the needs of all its students.
In dealing with the safe-distancing measures implemented at SMU’s Li Ka Shing library this semester, students will find one of two problems.

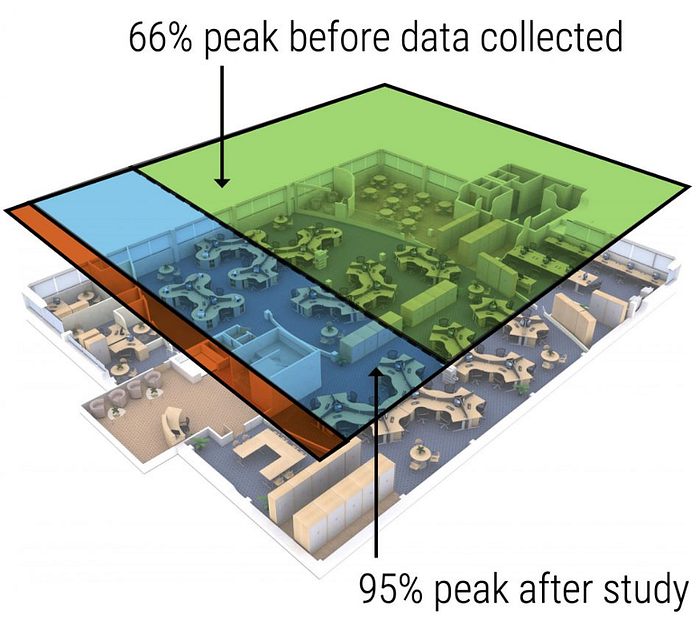
The first is entering a library that now has a strict maximal capacity of 1,150 students. At peak hours during exam period, long queues form outside the LKS library entrance, with new students only allowed in when existing library patrons leave.
If they were lucky to get into the library, they would be faced with the next challenge — finding a seat that is vacant, safely distanced, and not hogged.

Existing solutions for monitoring capacity at LKS library do little to tell you where to find an available seat. Similarly, the library heatmap (which is now offline) does not tell you if there is a seat available, or if it has been ‘reserved’ by a seat hogger.
OUR PROPOSAL
As such, we propose to adopt IOT to improve the management of resources at the LKS library with a SeatFinder system. This system will be a combination of sensors that can detect seat occupancy and connected via gateways to a central system that can map seat availability across the library in real time.
Instead of telling you if the library is full or not, SeatFinder thus intends to allow students to quickly find a seat that is available and safely distanced from everyone.
This data then benefits other stakeholder. Management and operations staff and of the library can use the data from the system to better manage their resources, such as sanitization, security, and spot checks.
HIGH-LEVEL SOLUTION DESIGN
RAISON D’ETRE: DETECTING SEAT OCCUPANCY
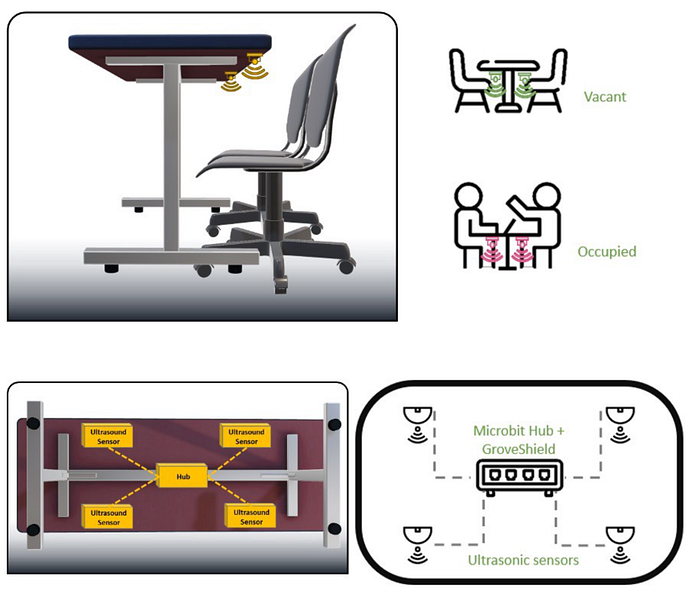
As fundamental goal of the system is to detect seat occupancy, much of our consideration was focused on sensor types. The team narrowed the options down to two main types.
Common occupancy sensors such as acoustic sensors, microwave sensors and capacitive sensors were eliminated from consideration due to the following reason; Acoustic, microwave did not fit the environmental conditions found in the LKS Library while capacitive sensors which were used in an earlier SMU Library study was not ideal because it was used for a booth where the seats were fixed. Most seats in the LKS Library were not fixed and could be moved around freely.
The remaining two options that were suitable for our needs were the PIR sensor and the Ultrasonic rangers. Both offer advantages and disadvantages listed below:
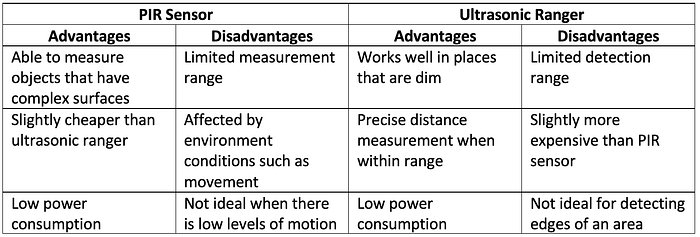
While there was little to separate the two, the team decided to utilise ultrasonic rangers for its precision in detecting per seat occupancy. We also evaluated that PIR sensors may inaccurately record false positives due to movement in the library. Some more complex applications make use of both PIR and ultrasonic technologies to eliminate the possibility of false positives.
SYSTEM ARCHITECTURE
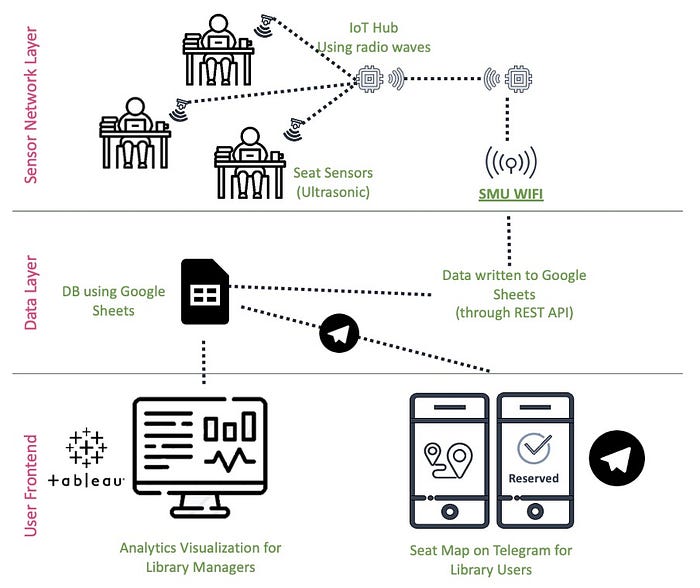
Our IoT proof-of-concept was tested at SMU and is envisioned for future deployment at the LKS library. In terms of design, there are three main components: sensors, data and user front (for both library users and library managers).
As the system will be implemented indoors, we will be able to leverage cost savings as power and Wi-Fi connectivity is readily available. This means that we can rely on mains for powering the sensors and rely on LKS Wi-Fi for transmitting data from the sensor gateways to the data backend. Finally, both sets of intended users can interact with SeatFinder through the planned visualization reports and Telegram interface.
KEY INSIGHTS
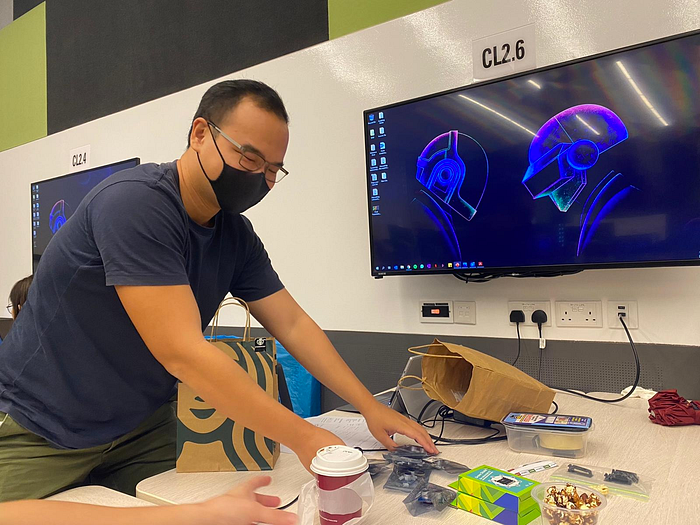
As we were able to deploy the project for only a day, and only at 2 tables situated on two different levels, our main insights are limited to the main usage of the system for seat occupancy and seat finding. These were:
#1 DETECTION
Based on our tests, the system was able to deliver 87.1% accuracy for true positive seat detection:
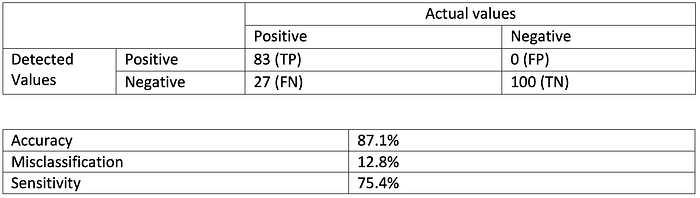
However, there was some issues with the sensitive rate (75.4%) with about 12.8% of the results being false negatives. This meant that our sensors were wrongly classifying a seat as being unoccupied once every ten times.
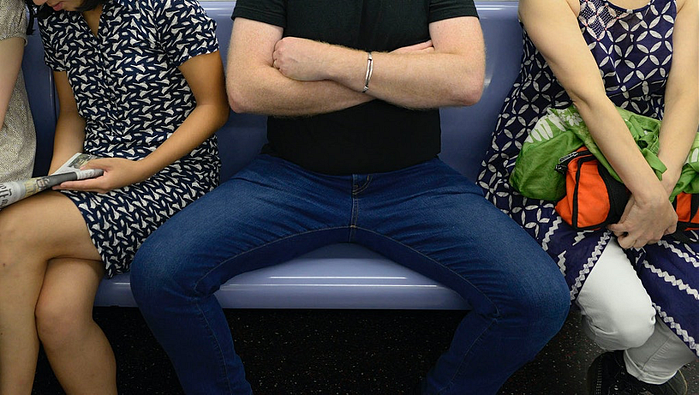
Our investigations into the reasons for misclassification revealed two main factors. The first of which was the seating difference between male and female subjects. Almost all the misclassified cases (22 out of 27) were attributed to male subjects. The reasons for this were rather obvious only on hindsight.
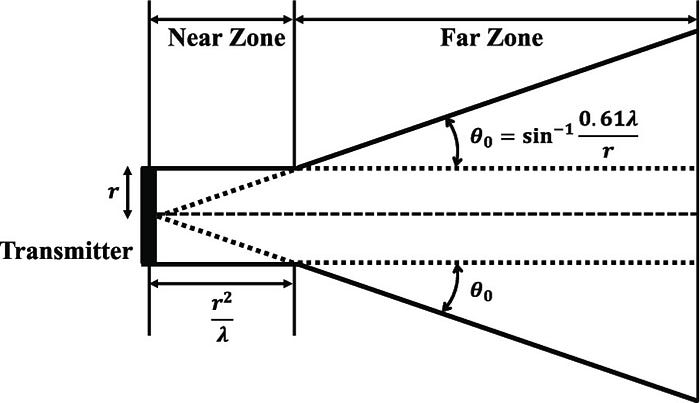
As our ultrasonic rangers cast a very narrow beam, they could not detect if the seat was occupied if his or her legs were not put together directly under the ultrasonic ranger, resulting in misclassification. This would be something that requires further thought and experimenting if the solution is implemented.
#2 INTERFERENCE
When we first prototyped the system for setup in the room of a teammate’s home, we faced occasional interference and range issues between the sensors and the gateway, which could have been cause for concern when testing at the library. However, when the same setup was implemented at SMU, there was no such issue. One possible cause for this could be the specific layout of the teammate’s room that caused this. For layouts that experience significant interference, a different communication protocol need to be explored.
#3 INTEGRATION
GATEWAY
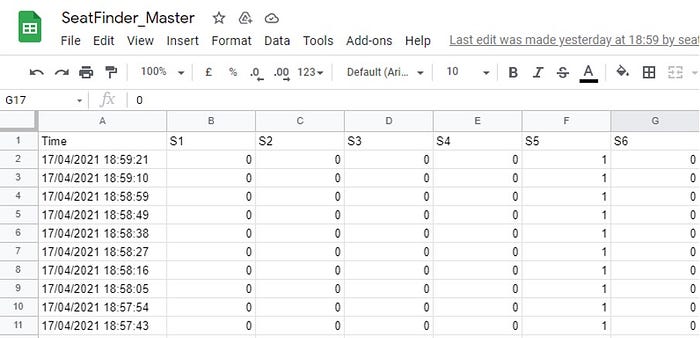
For the scope of the project, our system was designed to write data directly received from the gateway to Google Sheets via a gateway. Since the sensors are placed under the table above the chair, the distance from the sensor to the chair when it is pushed in was measured to be around 20cm. Therefore, the sensors are coded such that if the distance between the sensor and chair is less that 20cm then it will send “1” (occupied) to the gateway else “0” (available).
The data from sensors is transmitted to the gateway every 10 seconds (1-occupied, 0-available). However sometimes there might be one or more sensors that do not transmit data due to poor radio signal strength or a sensor node might be faulty. To handle such scenarios, the gateway python script was coded such that it writes data into Google sheets every 10 seconds and if there is any sensor that did not transmit any data during this 10 seconds buffer time then it will consider the previous data of that sensor.
TELEGRAM
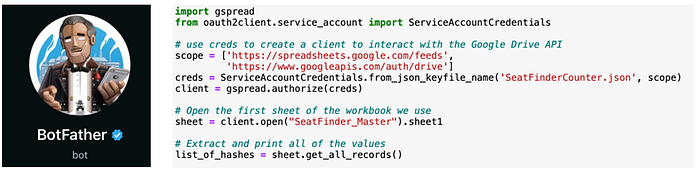
The Telegram bot was created using BotFather and Python. The Python notebook was designed to get data directly from the google sheet via the google drive API on python using “gspread”. The Python file updates and gets the latest data from the google sheet in 10 second intervals.
#4 DESIGNING IoT FOR USE WITHIN A FRAMEWORK
The biggest hurdle is hoping that behavioural change (regarding seat hogging) can be reduced through such a system (it cannot). An IoT solution that aims to help students find empty seats within the school library is simply that. It cannot change prevent students from hogging seats. However, IoT systems can work within a set framework of rules to help plug gaps.
When speaking to LKS Library staff, we found that they were serious, but unable to implement their library usage policy which empowers students to remove any items left unattended for more than 30 minutes. A system that can track if a seat has been unoccupied for the past 30 minutes would thus be ideal for executing such a policy. This means that our IoT system, SeatFinder, can be slightly modified to work within the framework of the library usage policies in order to deal with the scourge (sic) of seat-hogging!
#5 SENSEMAKING FOR DIFFERENT STAKEHOLDERS
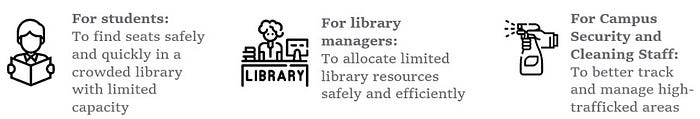
For Students
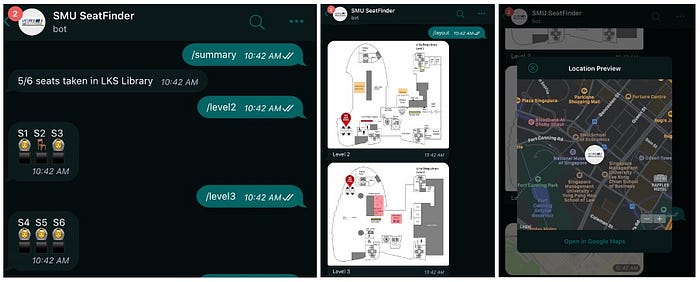
In the immediate term, students will be able to benefit from SeatFinder as they will be able to easily obtain information on available seats in the library by interacting with the Telegram Chat Bot. With the bot being on Telegram, it saves them the hassle of having to open a separate app or a webpage. With Telegram being one of the main forms of communication for SMU students, it is one of the best avenues for a quick check.
Ideally, the use of the bot will help them save time from searching for a seat in a crowded library spread across the 4 levels and even the time it takes from getting to the library, only to find its full. Additionally, they can also see the layout of the library for a more direct route to the seats and see the have the google map location of the library for easier navigation from wherever they might be.
For Library Managers
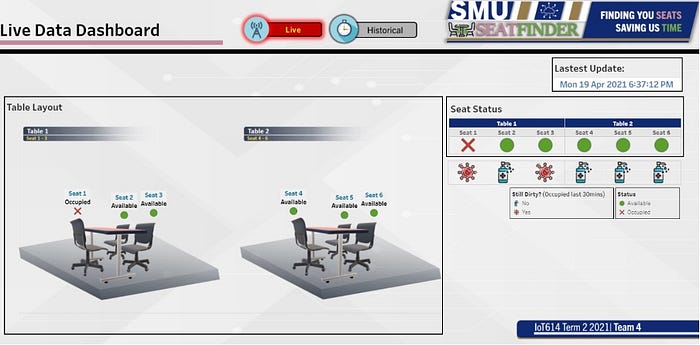
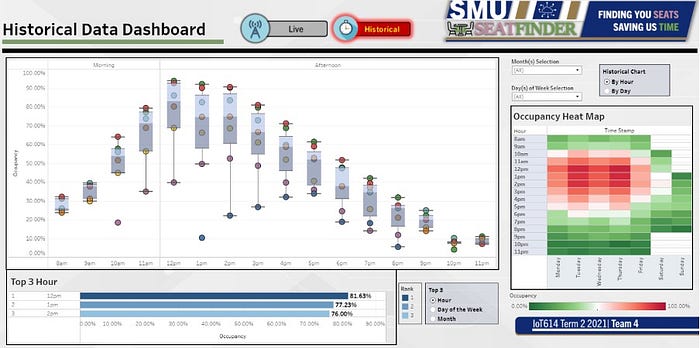

As for our two other stakeholders, two dashboards are simulated with Tableau to show Live data from the Google Sheets and Historical data aggregated.
While we are not able to do this now, the goal is to derive long term insights that will help library managers plan resources better when we are able to do so with more data. For instance, from the occupancy heat map, library managers will be able to make better decisions knowing occupancy data. These can include the identification of how to plan around peak hours — such as planning library events during or after that period (between 11am to 3pm).
This can also be changed from daily view to monthly view to identify if there is a need to encourage traffic to re-directed to less occupied spaces in the library.
From the Live Dashboard, cleaning staff can also make use of the dashboard to only clean the seats that have been occupied for a period of time rather than clean all seats, thus saving them time. Security Staff could also patrol only the areas (seats) that are currently occupied and optimize their patrol path.
Public Tableau Dashboard: https://public.tableau.com/views/SF_16188133382820/DB_L
LEARNING AND DISCUSSION POINTS
SCALABILITY
In terms of scaling up the project for longer term usage, the team will need to consider adopting a proper database (such as ThingSpeak) that can deal with large volumes and flows of data instead of using Google Sheets.
COST OF IMPLEMENTATION
The total cost of implementation for this project will also be expensive due to the need to sensorize every chair to determine occupancy. At a cost of about $8 per ultrasonic sensor (1,150 seats), and $20 per microbit (383 microbits for 1,150 seats) — the total cost of implementing sensors for the entire LKS library will be at least $16.8k.
IDK — I DON’T KNOW WHAT WISDOM IS
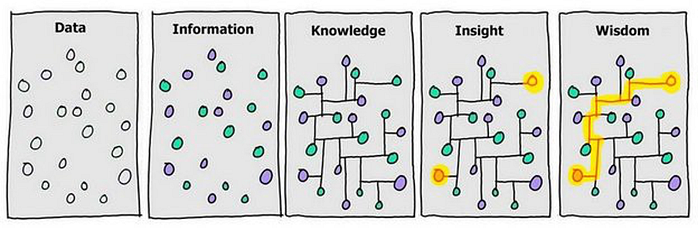
Finally, getting to the wisdom part of the DIKW pyramid is a lot more difficult in practice than in theory. Before we embarked on the project, we had grandiose plans of how the project can be used to track human flows, allow for library managers to utilize data to improve shared spaces, target cleaning efforts.
However, getting to this stage is not that easy as it involves much longer-term collection of data. Data collected will also have to be accurate, reliable, and then wrangled for analysis. Ultimately, the findings from the data may even differ greatly from the initial hypothesis made at the start of the project many months before.